In the world of complex distributed systems, Kubernetes has become a leading container orchestration platform for running applications. Kubernetes monitoring tools are essential for managing Kubernetes clusters and ensuring optimal performance. Kubernetes Dashboard, Prometheus, and Grafana are arguably the most popular tools for monitoring Kubernetes environments. Together they provide an effective monitoring system for K8s.
Monitoring Kubernetes is crucial for understanding your applications’ performance and identifying potential issues. Kubernetes monitoring tools are designed to monitor Kubernetes clusters, collect system metrics, and visualize data, enabling you to make informed decisions about your Kubernetes infrastructure.
Kubernetes Monitoring with Prometheus
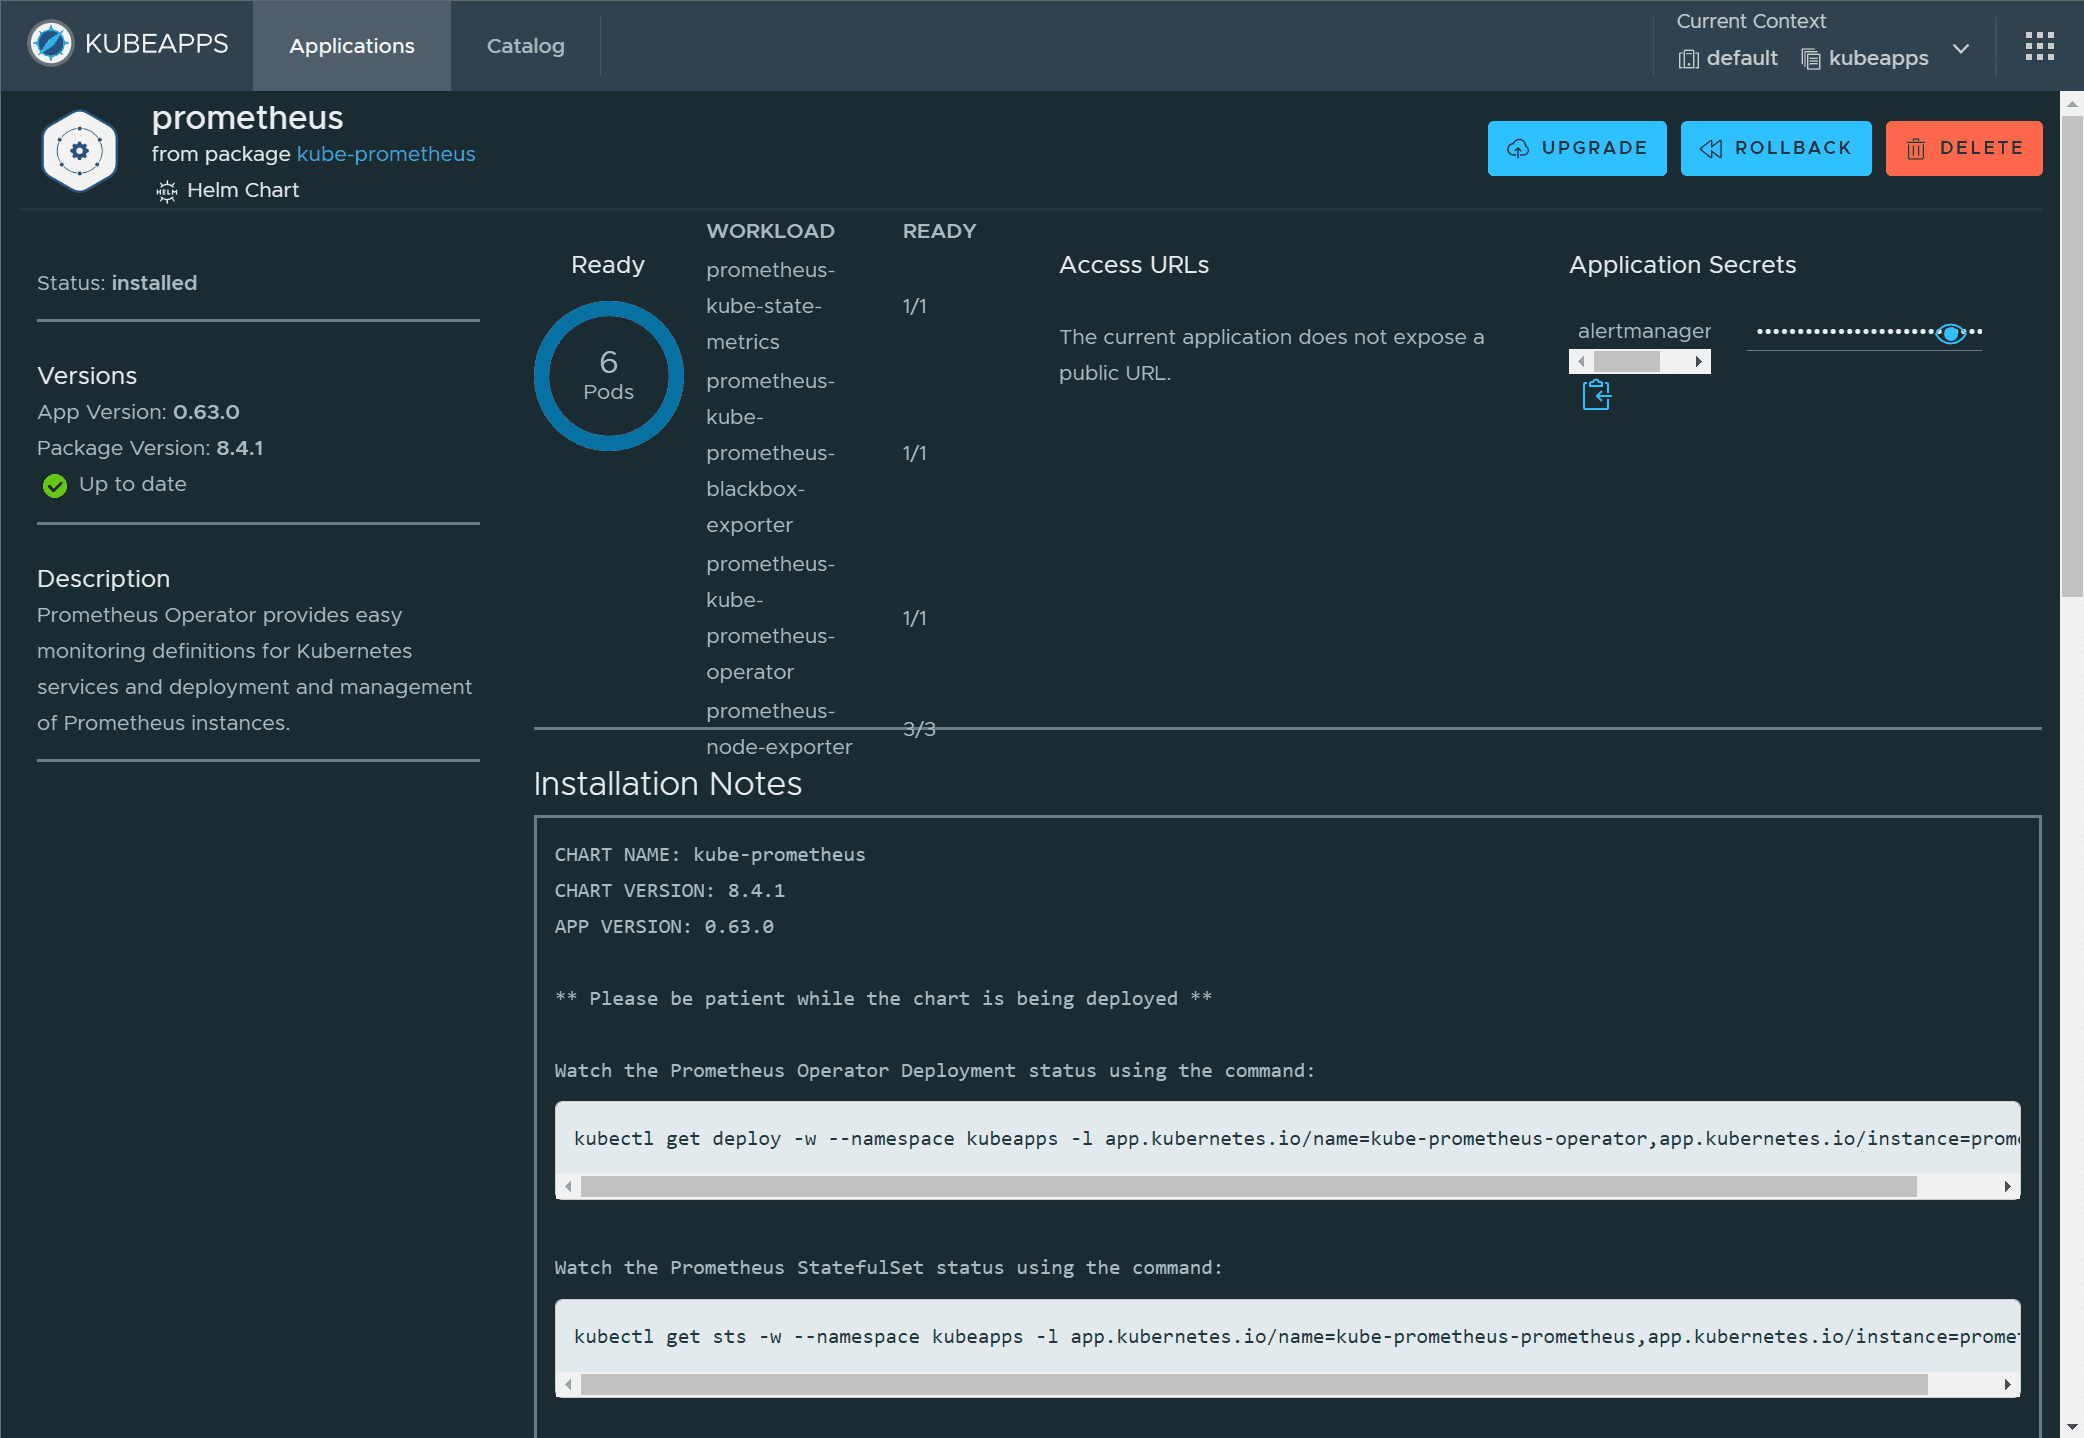
Prometheus, a project of the Cloud Native Computing Foundation, is an open-source Kubernetes monitoring tool for collecting and processing metrics from the Kubernetes API server, Kubernetes resources, and system metrics. It uses a multi-dimensional data model with a flexible query language to collect and store data, making it an ideal monitoring solution for Kubernetes environments.
Prometheus collects system metrics from Kubernetes clusters by running containers that scrape metrics from Kubernetes objects, such as nodes, pods, and services. These lightweight data shippers are called Prometheus exporters, and they generate metrics for resource usage and performance, including CPU, memory, and network usage statistics.
To monitor Kubernetes using Prometheus, you need to deploy it within your Kubernetes environment. Prometheus integrates with Kubernetes API to discover and monitor Kubernetes resources like pods and services. You can then use the Prometheus query language (PromQL) to analyze resource utilization, latency optimization, and other essential metrics related to your Kubernetes infrastructure.
Distributed transaction monitoring is another feature of Prometheus, allowing you to track the performance of your applications across different Kubernetes clusters. This is particularly useful when dealing with microservices architectures, where service dependency and root cause analysis can be challenging.
Visualizing Kubernetes Metrics with Grafana
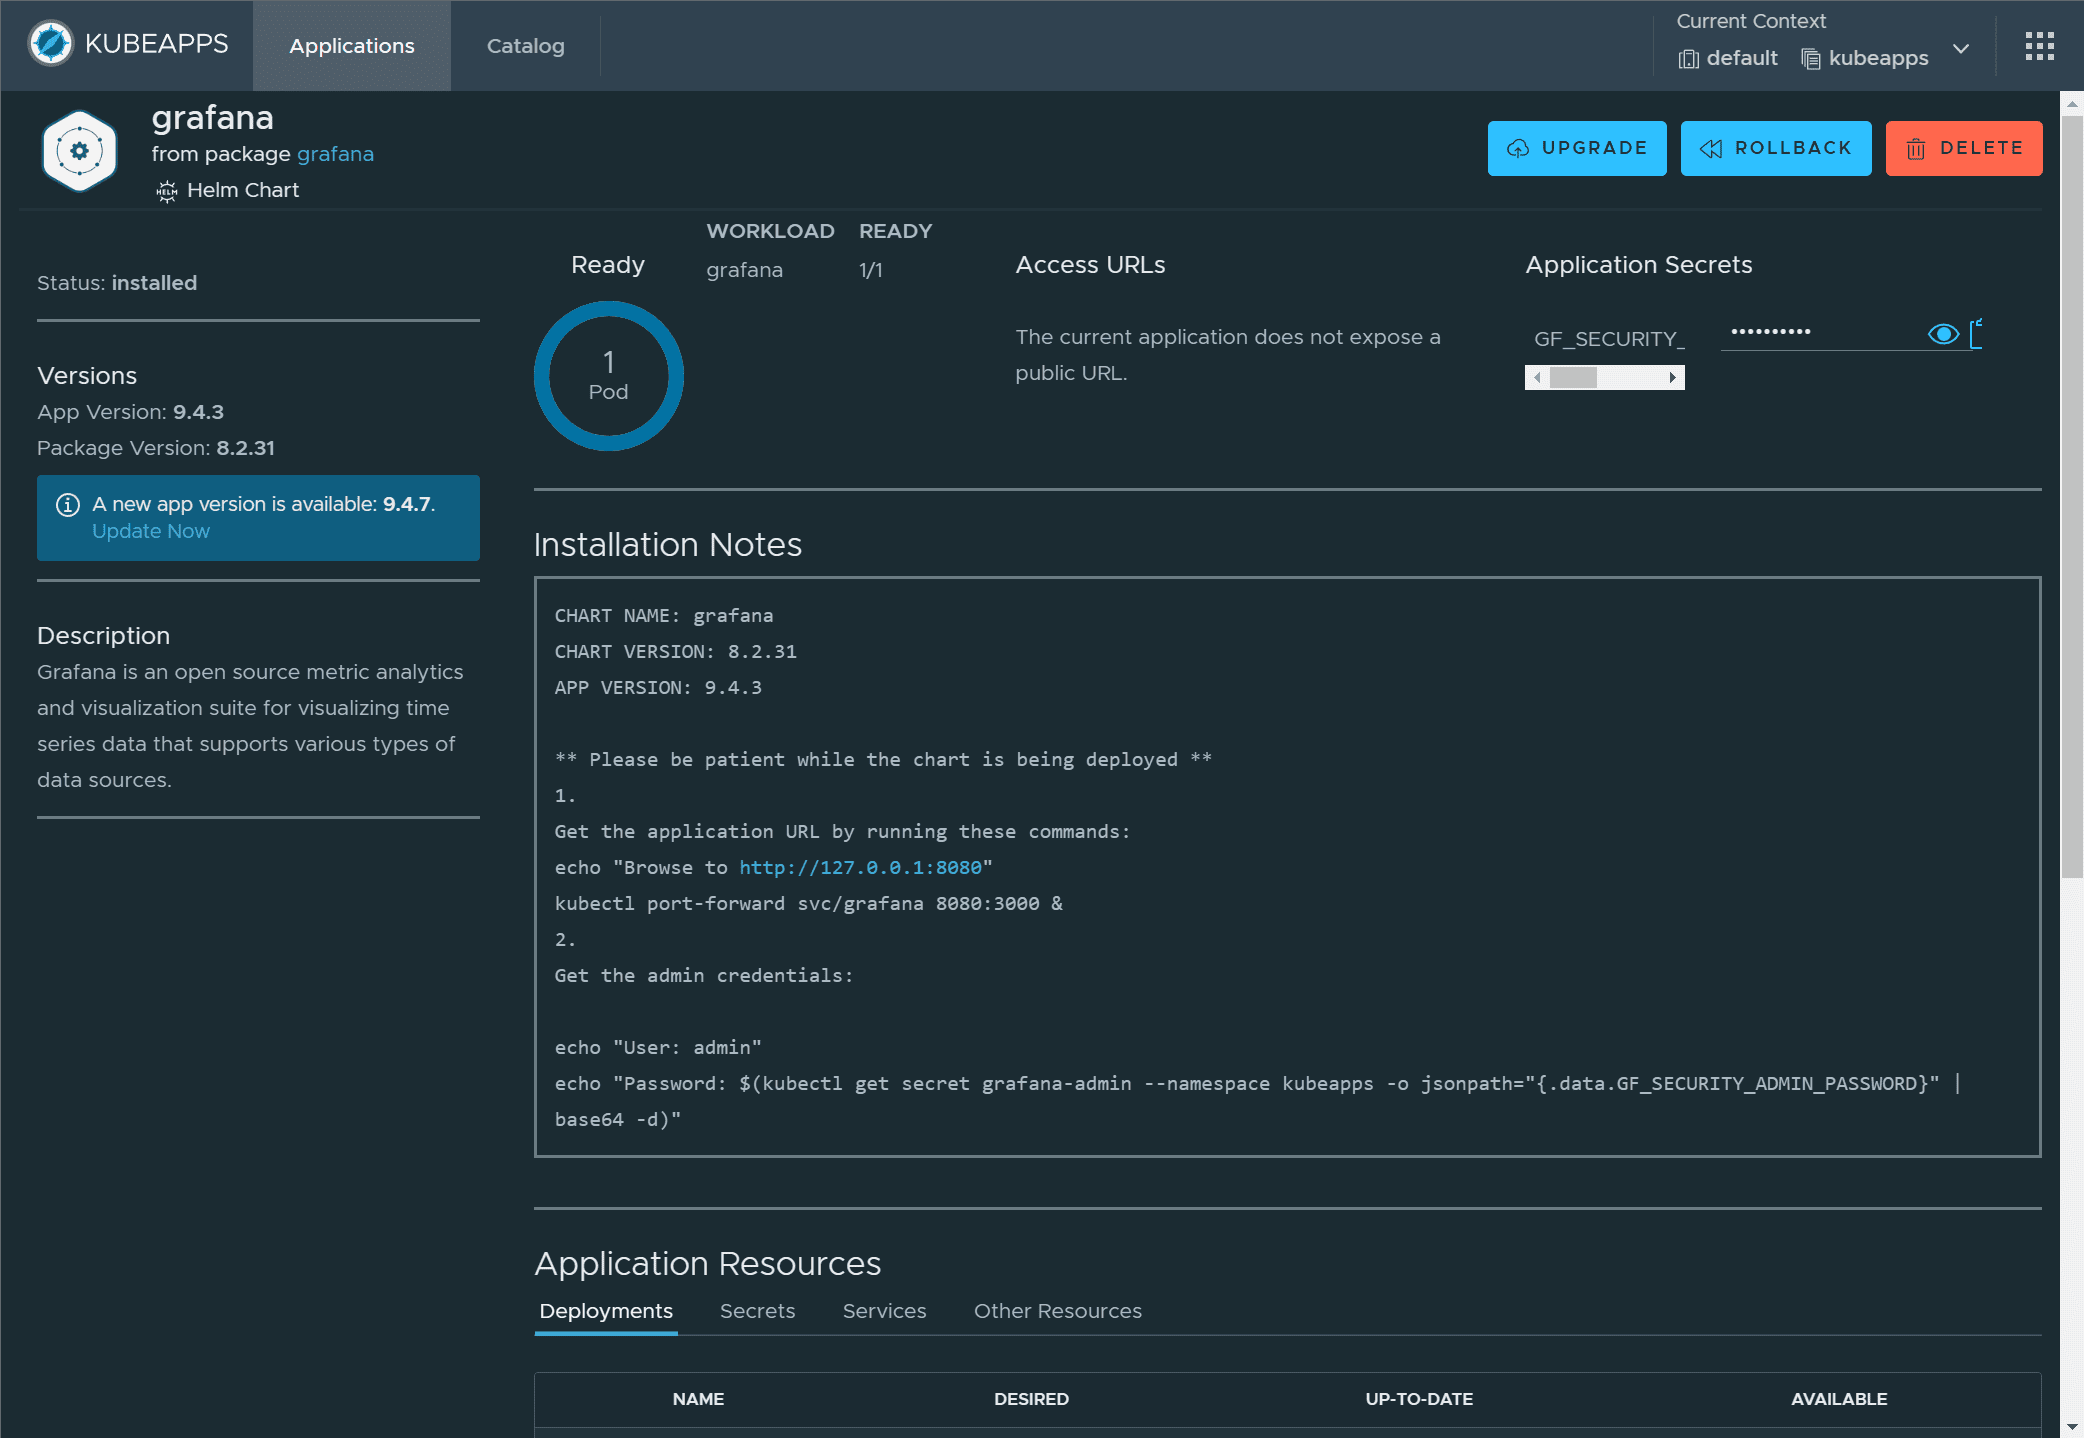
Grafana is an open-source, full-stack monitoring solution for visualizing time series data. It supports multiple data sources, including Prometheus, making it an ideal tool for visualizing Kubernetes metrics. Grafana provides a user-friendly interface for creating customizable dashboards to display resource usage, disk usage, and other metrics related to your Kubernetes clusters.
To use Grafana with Prometheus, you need to configure the Prometheus data source in Grafana. This allows Grafana to fetch metrics data from Prometheus, enabling data source-specific querying and visualization of Kubernetes data.
With Grafana, you can create dashboards for monitoring Kubernetes clusters, resources, and applications. You can visualize Kubernetes environment metrics, such as CPU and memory usage, and set up alerts to notify you of potential issues. Grafana’s flexible query language makes it easy to explore and analyze the multidimensional data model provided by Prometheus, making it a powerful tool for Kubernetes monitoring.
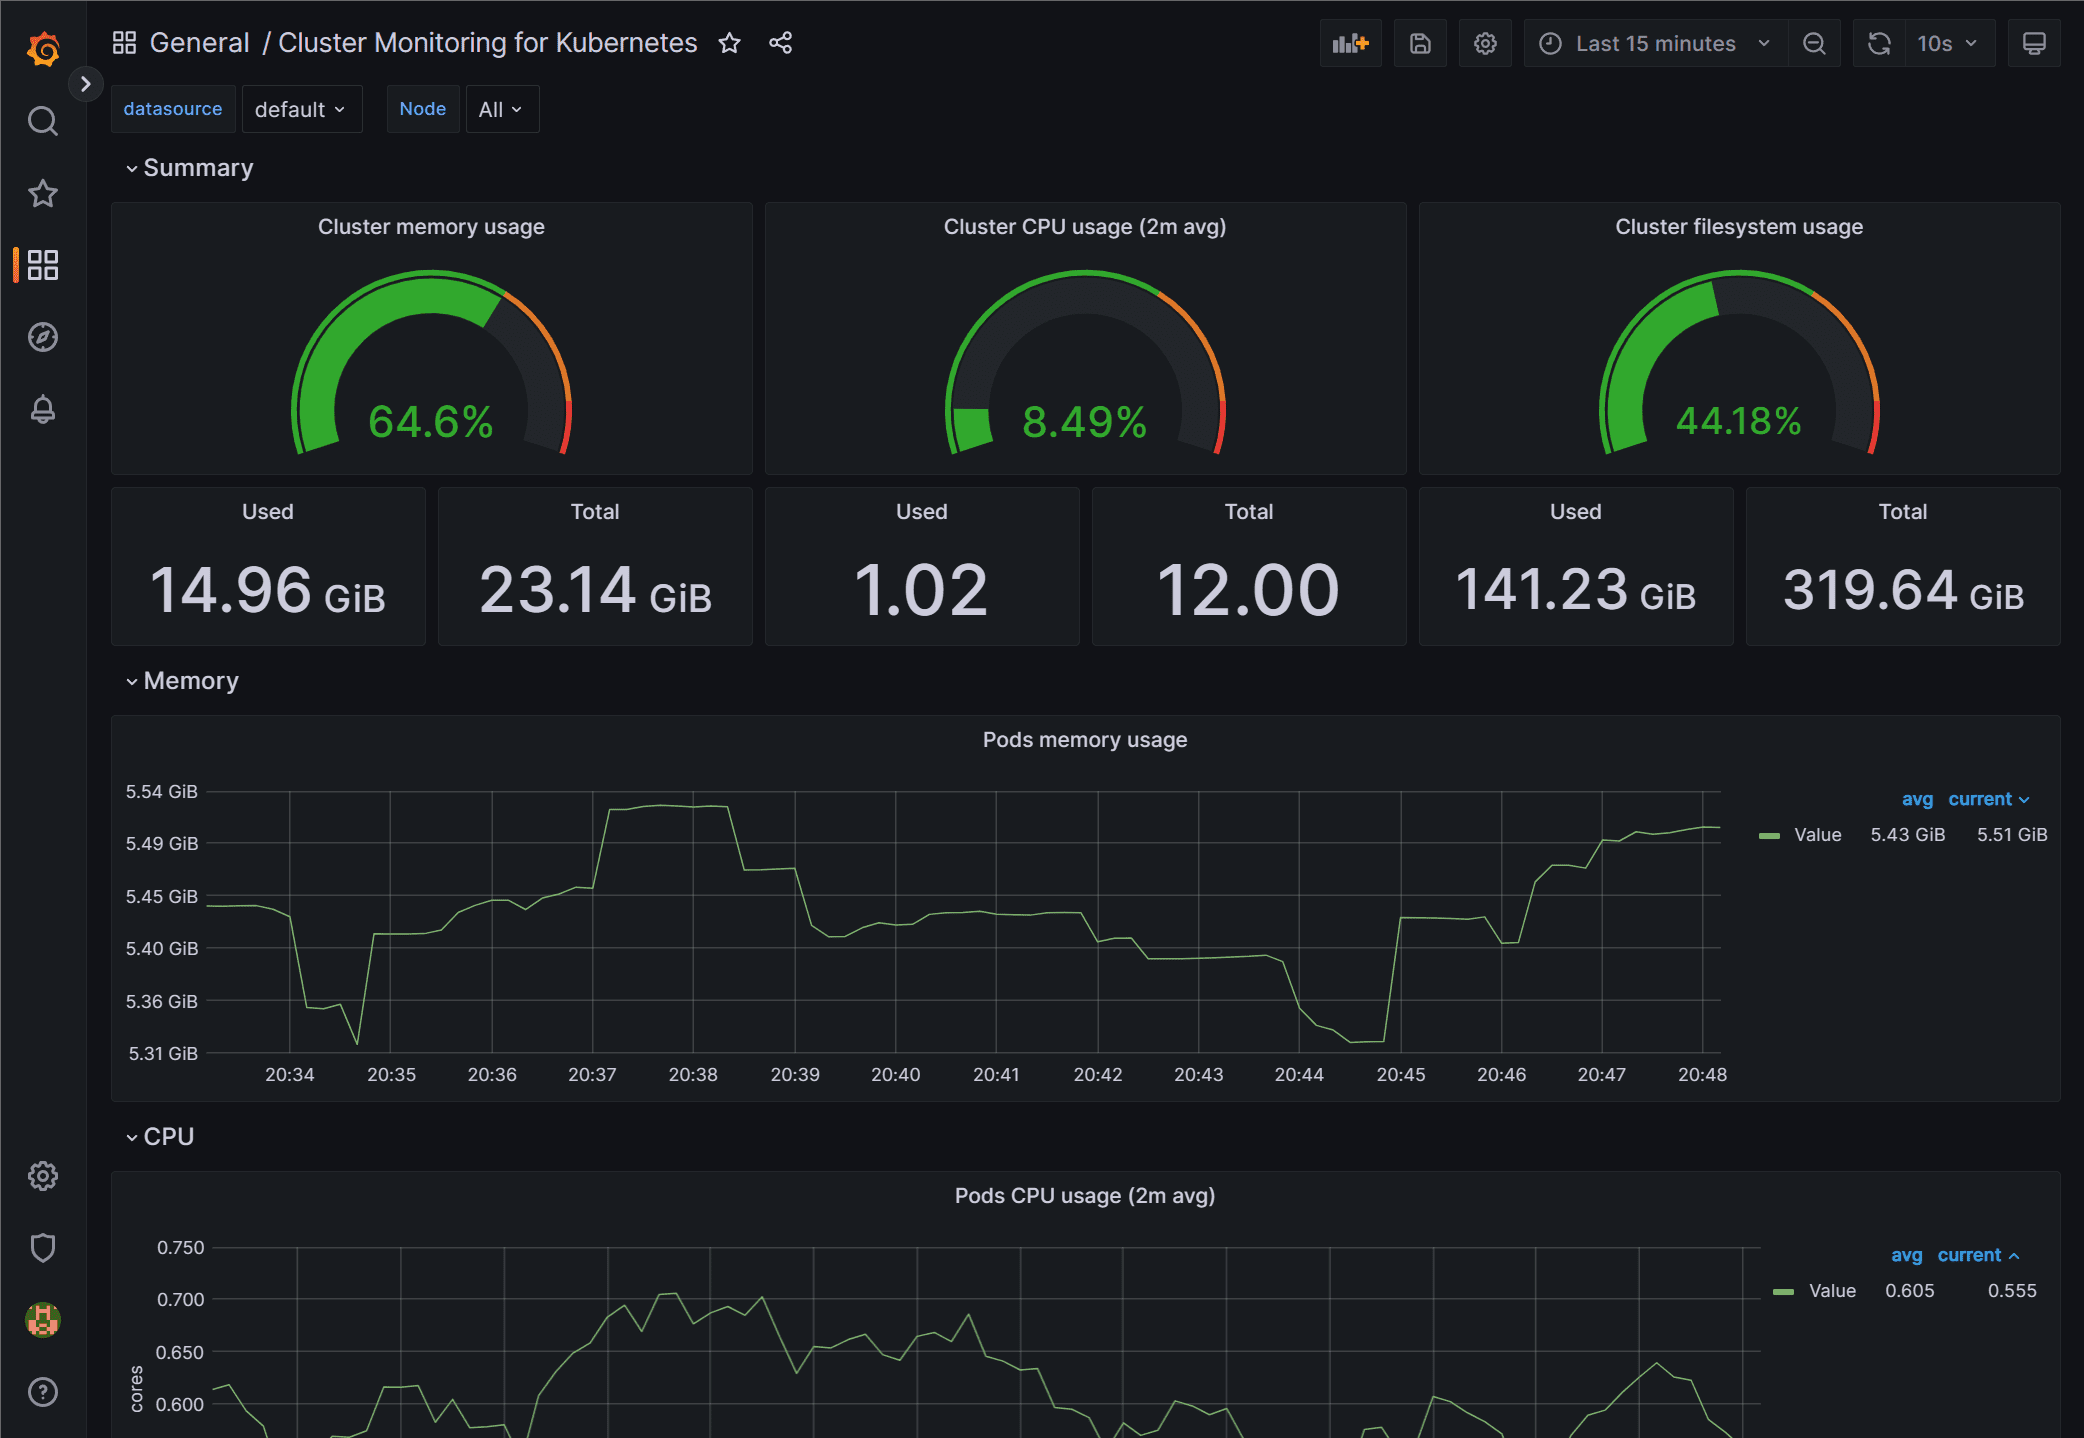
Below is a Grafana dashboard showing the overview of cluster statistics:
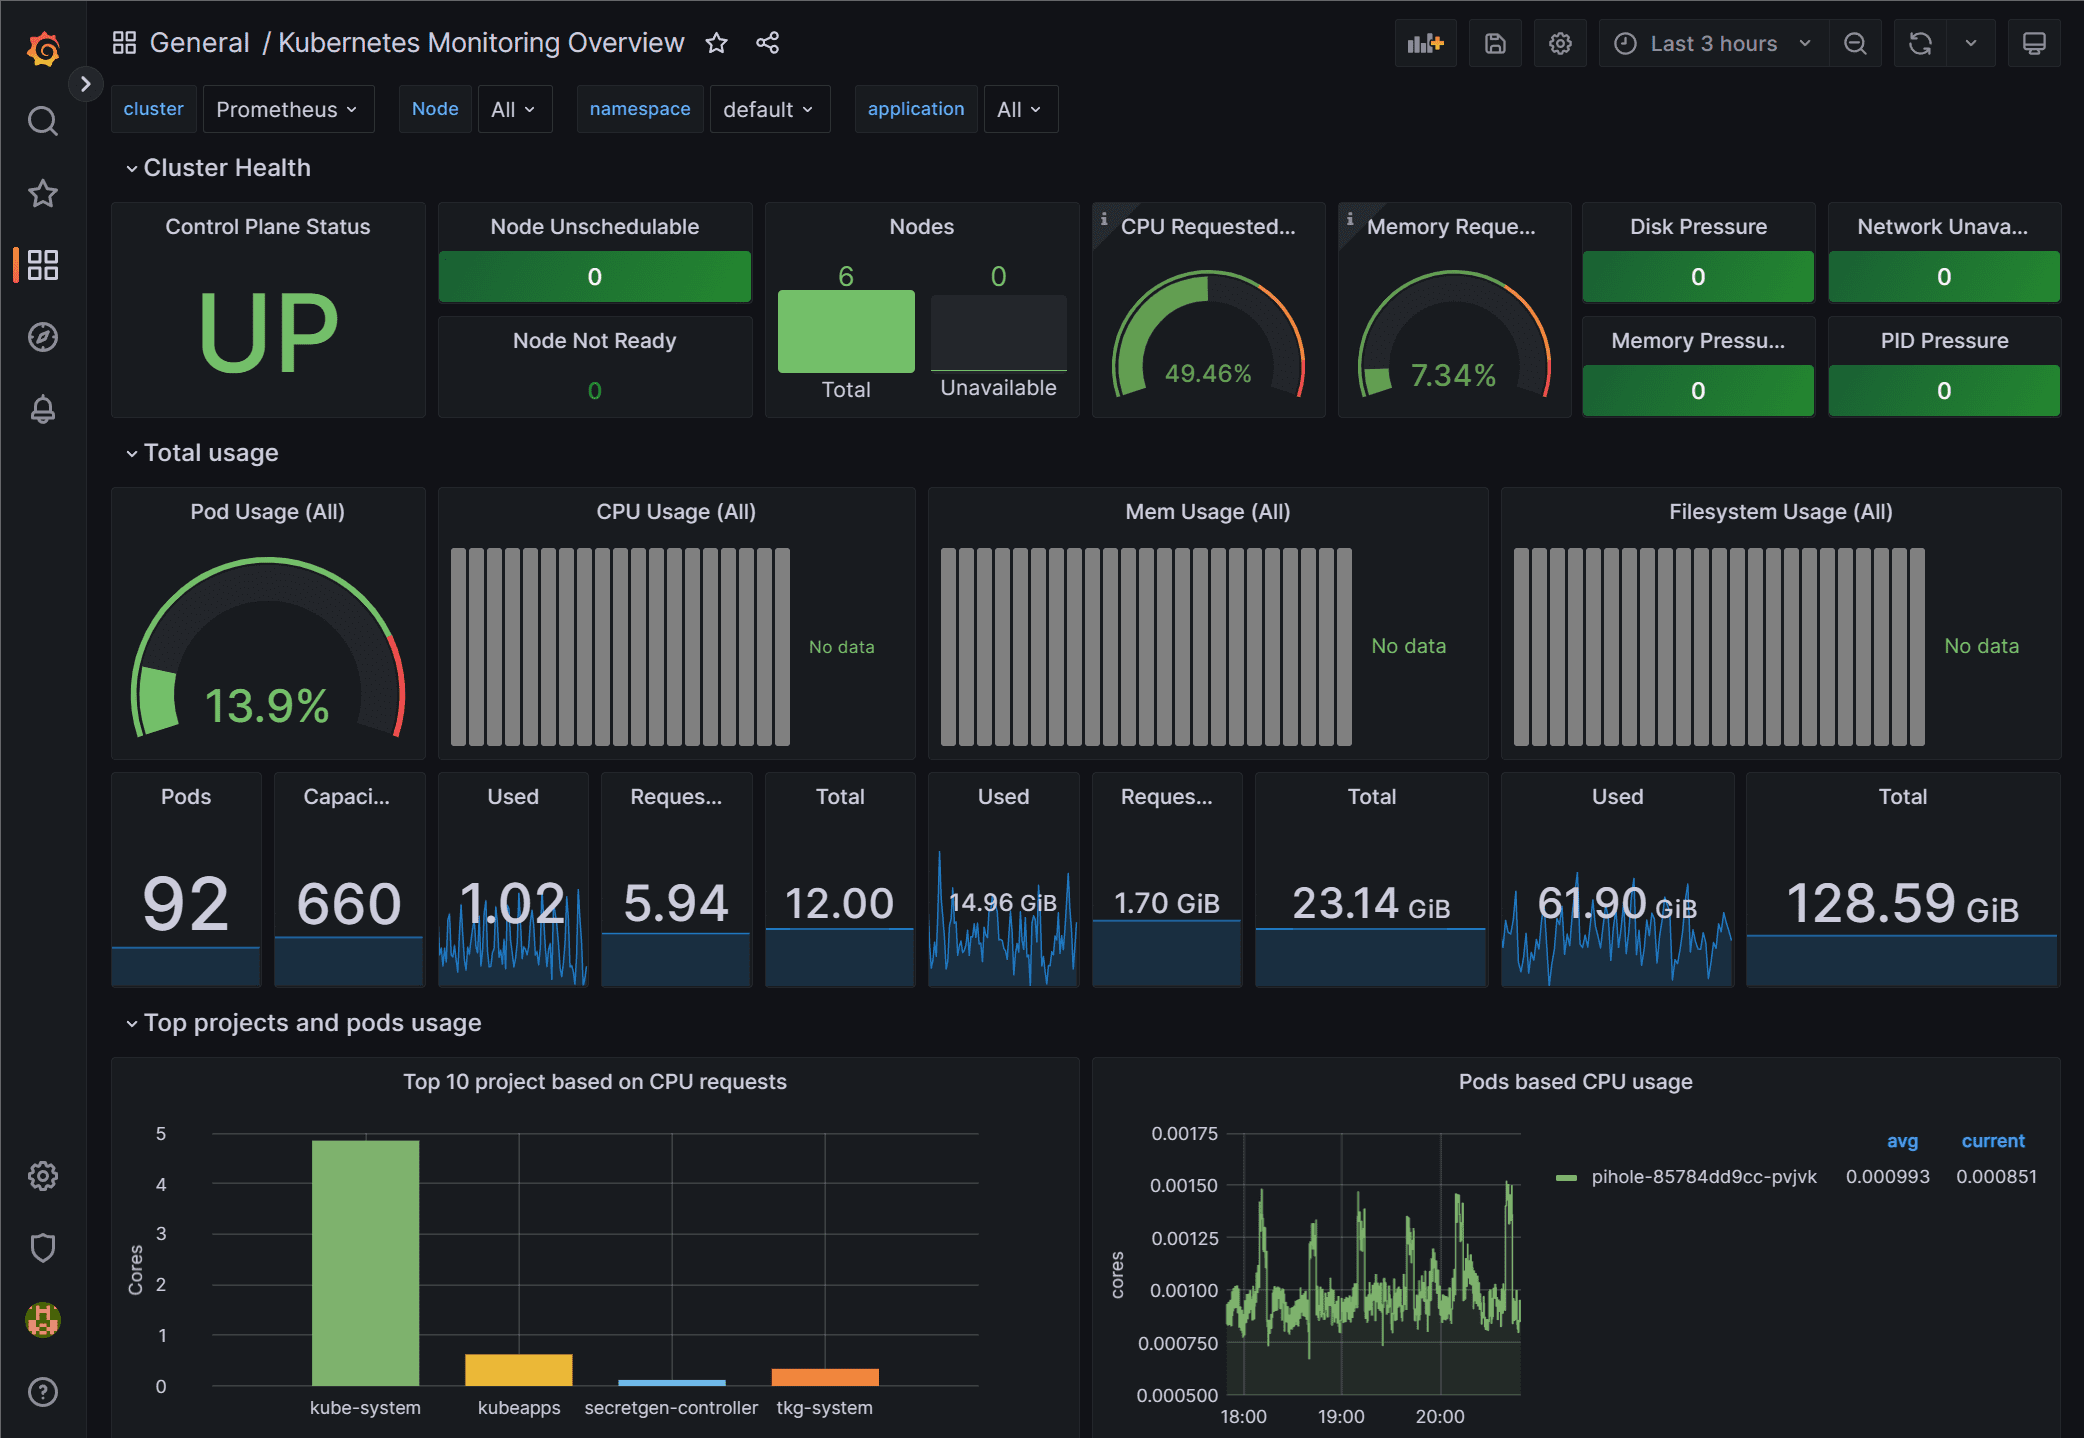
Another Kubernetes dashboard in Grafana displaying a wealth of cluster statistics.
Kubernetes Dashboard: A Web-based Monitoring Tool
Kubernetes Dashboard is a web-based Kubernetes monitoring tool that provides an overview of your Kubernetes cluster, including the current state of your Kubernetes resources, resource usage, and system metrics. It lets you view and manage your Kubernetes objects, such as replication controllers, services, and pods.
You can use the Kubernetes Dashboard to monitor resource consumption, resource metrics, and usage statistics of your Kubernetes environment. The Dashboard also enables you to run diagnostic commands, view log data, and perform other management tasks.
Kubernetes Dashboard is an excellent starting point for monitoring your Kubernetes infrastructure, but it might not be sufficient for all your Kubernetes monitoring requirements. Combining Kubernetes Dashboard with other monitoring tools, such as Prometheus and Grafana, can provide a comprehensive monitoring and observability strategy.
Integrating Prometheus and Grafana with ELK Stack
For a complete Kubernetes monitoring solution, consider integrating Prometheus and Grafana with the ELK Stack (Elasticsearch, Logstash, and Kibana). ELK Stack is a popular open-source log data aggregation, analysis, and visualization monitoring tool.
Integrating Prometheus and Grafana with the ELK Stack, you can achieve a full-stack monitoring solution covering metrics and logs. Elasticsearch, Logstash, and Kibana can work together to collect, process, and visualize log data, while Prometheus and Grafana focus on metrics data.
Elasticsearch is a distributed storage and search engine that can store and index log data from Kubernetes environments. Logstash is a data processing pipeline that collects logs from various sources, including Kubernetes pods, and sends them to Elasticsearch. Kibana provides a web interface for visualizing and exploring log data stored in Elasticsearch.
Combining these tools allows you to build a comprehensive monitoring solution for your Kubernetes environment, including application performance monitoring, resource usage monitoring, and service dependency analysis.
Monitoring Kubernetes in Virtual Machines and Hybrid Environments
Kubernetes monitoring tools are not limited to Kubernetes clusters running on bare-metal or cloud infrastructure. You can also use these tools to monitor Kubernetes environments running on virtual machines or hybrid environments where Kubernetes clusters are deployed across multiple infrastructures.
Monitoring Kubernetes in virtual machines requires the same tools as monitoring Kubernetes on physical hardware. You can use Prometheus to collect resource usage and performance metrics, Grafana to visualize the data, and ELK Stack to aggregate and analyze log data.
In hybrid environments, where Kubernetes clusters are deployed across multiple infrastructures, you can use monitoring tools like Prometheus to monitor Kubernetes clusters in each environment. By deploying Prometheus instances in each environment and configuring them to scrape metrics from the appropriate Kubernetes API server, you can monitor the performance and resource usage of each Kubernetes cluster.
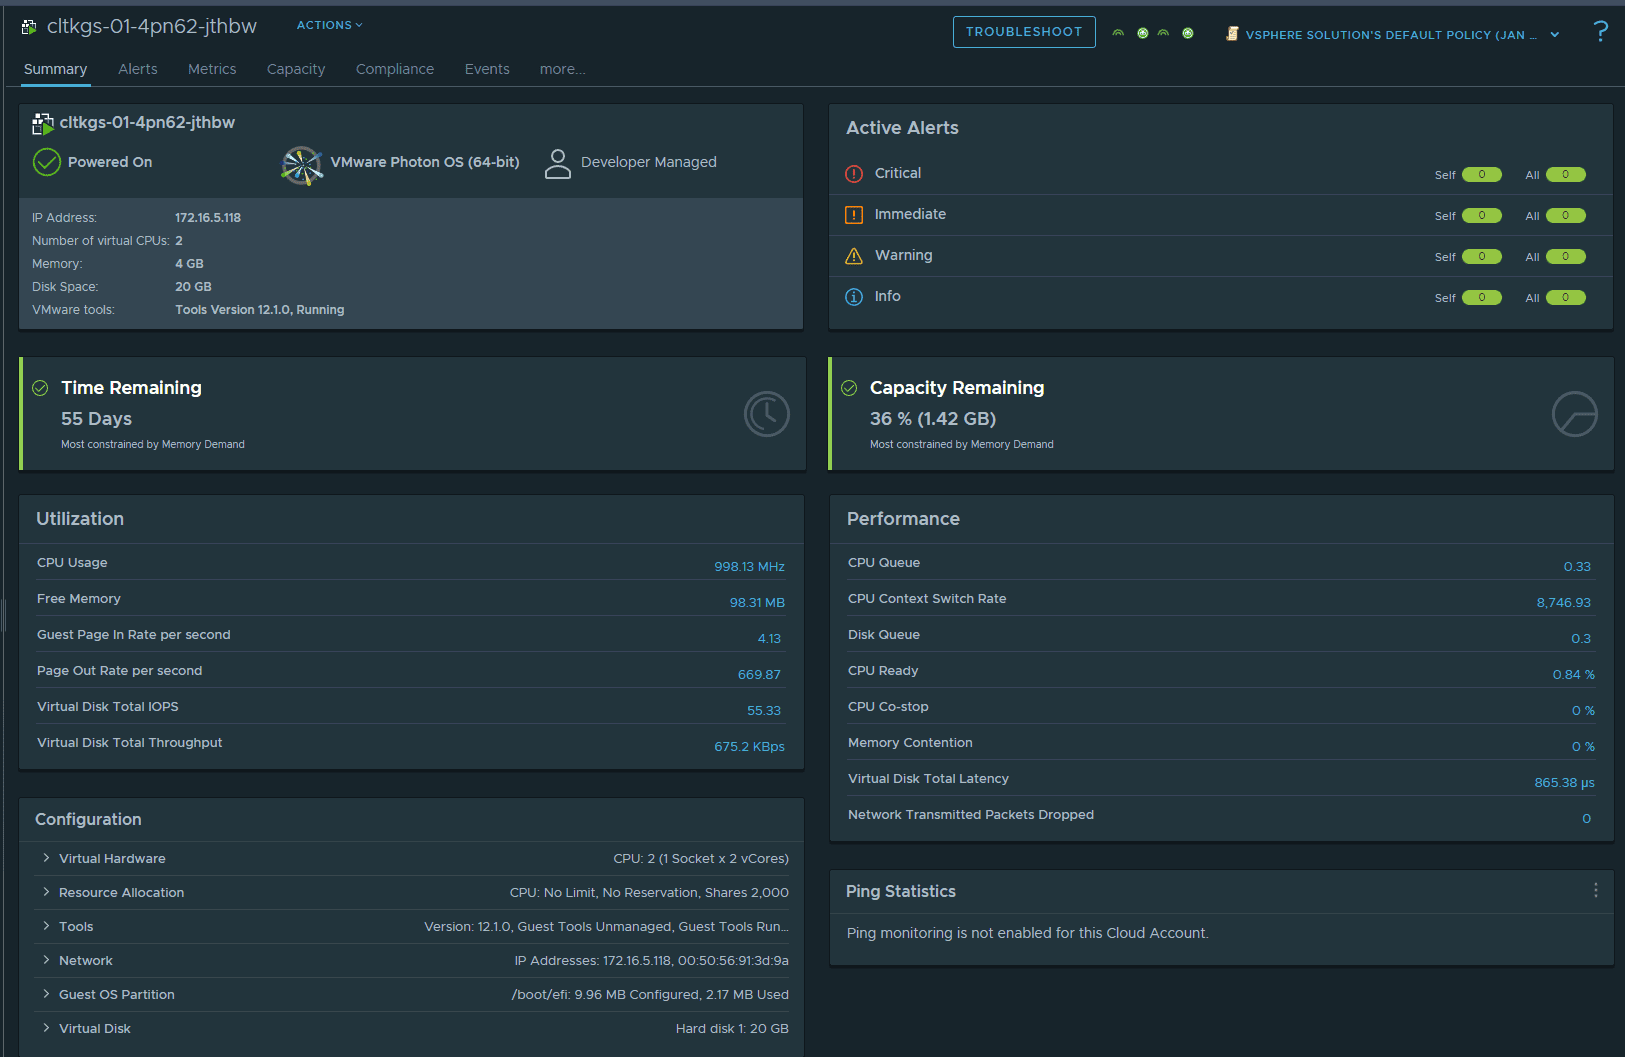
Depending on the underlying infrastructure, you can also use tools to monitor the Kubernetes virtual machine hosts. Below is a look at Workload inventory management in vRealize Operations (Aria).
However, you can also monitor VMs and infrastructure using Prometheus and Grafana as well.
Adopting Monitoring and Observability Strategies
When monitoring Kubernetes environments, adopting monitoring and observability strategies that suit your organization’s needs is crucial. A successful monitoring strategy involves deploying and configuring the right Kubernetes monitoring tools, setting up alerts and notifications, and continuously analyzing and optimizing your Kubernetes environment.
Container Resource Usage Monitoring
Monitoring container resource usage is a critical aspect of managing Kubernetes environments. You can use Prometheus to collect and store container resource usage data, such as CPU, memory, disk usage, and network usage statistics. Grafana can then visualize this data, providing insights into resource consumption patterns and helping you identify potential bottlenecks and inefficiencies.
Service Dependency Analysis and Root Cause Analysis
In microservices architectures, it’s essential to understand the dependencies between services and track their performance. Kubernetes monitoring tools like Prometheus can provide service dependency analysis, allowing you to identify issues and perform root cause analysis more effectively.
Monitoring Transactions and Latency Optimization
Monitoring transactions and optimizing latency are crucial for ensuring the performance and reliability of your applications. Prometheus is an excellent tool for monitoring transactions in Kubernetes environments, while Grafana allows you to visualize transaction data and identify areas for latency optimization.Kubernetes Operator for Monitoring Tools
Kubernetes operators are a way to automate and manage the lifecycle of applications running on Kubernetes. You can use Kubernetes operators to deploy and manage your Kubernetes monitoring tools, such as Prometheus and Grafana. This simplifies the deployment process and ensures your monitoring tools are always up-to-date and properly configured.
Customizing Kubernetes Monitoring with Configuration Maps
You can customize your Kubernetes monitoring tools by using configuration maps. Configuration maps are Kubernetes objects that allow you to store and manage configuration data, which your monitoring tools can consume. This lets you fine-tune your monitoring setup, ensuring you collect the right metrics and visualize the data to meet your needs.
Extending Kubernetes Monitoring with Third-Party Tools
In addition to Prometheus, Grafana, and Kubernetes Dashboard, several other third-party tools for monitoring Kubernetes environments exist. These tools can provide additional insights and capabilities, such as application performance monitoring, log data analysis, and resource usage tracking.
Some popular third-party Kubernetes monitoring tools include:
ELK Stack (Elasticsearch, Logstash, Kibana): A powerful log data analysis and visualization tool for Kubernetes environments.
Google Borg Monitor: A tool developed by Google for monitoring Kubernetes environments, inspired by Google’s Borg system.
Fluentd: A lightweight data shipper for collecting and processing log data in Kubernetes environments.
These third-party tools can be integrated with your existing Kubernetes monitoring setup, providing additional insights and capabilities to help you manage and optimize your Kubernetes environment.
Monitoring Kubernetes API Server and Client Library
Monitoring the Kubernetes API server is crucial for understanding the performance and availability of your Kubernetes environment. Prometheus can collect metrics from the Kubernetes API server, allowing you to track the performance and resource usage of the server. Additionally, you can monitor the Kubernetes client library to ensure your applications interact with the Kubernetes API correctly and efficiently.
Analyzing Disk Usage and Network Usage Statistics
Prometheus collects disk usage and network usage statistics from your Kubernetes environment, providing insights into how your applications and resources are utilizing disk and network resources. Grafana can visualize this data, allowing you to identify potential bottlenecks and optimize the performance of your Kubernetes environment.
Monitoring Kubernetes in Distributed Storage and Virtual Machines
Kubernetes monitoring tools can also be used to monitor Kubernetes environments deployed on distributed storage and virtual machines. This allows you to track the performance and resource usage of your Kubernetes infrastructure, regardless of the underlying hardware or storage configuration.
Using Kubernetes monitoring tools like Prometheus, Grafana, and Kubernetes Dashboard combined with third-party tools and custom configuration, you can create a comprehensive monitoring solution for your Kubernetes environment, whether deployed on distributed storage, virtual machines, or hybrid infrastructures.
Kubernetes Watcher and Metrics Generation
Kubernetes watcher is a feature that monitors changes in Kubernetes objects and generates metrics based on these changes. This enables you to track the state and performance of your Kubernetes resources in real-time, allowing you to make informed decisions about your Kubernetes infrastructure.
By integrating Kubernetes watcher with your Kubernetes monitoring tools, such as Prometheus and Grafana, you can visualize and analyze the generated metrics to gain insights into the performance and health of your Kubernetes environment.
Building and Running Applications with Kubernetes Monitoring Tools
When building and running applications on Kubernetes, it’s essential to have a robust monitoring solution in place. By using Kubernetes monitoring tools like Prometheus, Grafana, and Kubernetes Dashboard, you can track your applications’ performance and resource usage, ensuring they run optimally and meet your organization’s goals and requirements.
Additionally, integrating third-party tools and customizing your monitoring setup with configuration maps can provide even greater insights and capabilities, helping you build and run applications more effectively on Kubernetes.
Running Containers with Kubernetes Monitoring Tools
Monitoring running containers is an essential part of managing your Kubernetes environment. Kubernetes monitoring tools like Prometheus and Grafana can collect and visualize metrics related to running containers, such as CPU and memory usage, network usage, and disk usage. This information can help you identify potential issues and optimize the performance of your containers.
By integrating Kubernetes monitoring tools with third-party tools like the ELK Stack, you can also monitor log data generated by your running containers, providing even greater insights into the performance and health of your Kubernetes environment.
Data Source Specific Querying with Prometheus and Grafana
Prometheus and Grafana support data source-specific querying, allowing you to tailor your queries and visualizations to the specific metrics and data sources you’re working with. This enables you to create customized dashboards and visualizations that provide exactly the information you need to manage and optimize your Kubernetes environment.
By leveraging the flexible query language and multi-dimensional data model provided by Prometheus and Grafana, you can create powerful visualizations and analyses that help you monitor and optimize your Kubernetes environment effectively.
Consistent Upfront Sampling for Monitoring Kubernetes
Consistent upfront sampling is a technique used in monitoring systems to ensure that the collected data accurately represents the state of the system being monitored. By applying consistent upfront sampling to your Kubernetes monitoring setup, you can ensure that your monitoring tools collect accurate and representative data, enabling you to make informed decisions about your Kubernetes environment.
Prometheus supports consistent upfront sampling through its configuration settings, allowing you to customize the sampling rate and ensure that the collected metrics accurately represent the state of your Kubernetes environment.
Independent Nodes and Scalability in Kubernetes Monitoring
Kubernetes monitoring tools like Prometheus and Grafana are designed to be scalable and capable of monitoring large, complex Kubernetes environments. These tools can be deployed on independent nodes, enabling you to distribute the monitoring workload across multiple machines and ensuring that your monitoring setup can handle the demands of your Kubernetes environment.
By deploying your Kubernetes monitoring tools on independent nodes, you can ensure that your monitoring setup is scalable, reliable, and capable of handling the demands of your growing Kubernetes infrastructure.
Wrapping up
Kubernetes monitoring tools like Prometheus, Grafana, Kubernetes Dashboard, and third-party tools and customized configurations provide a comprehensive monitoring solution for Kubernetes environments. By deploying and configuring these tools, you can gain valuable insights into the performance and health of your Kubernetes clusters, applications, and resources. This enables you to make informed decisions about your Kubernetes infrastructure, optimize performance, and ensure the smooth operation of your applications.



0 Comments