Small businesses often have to do a lot with a little, in terms of the technology tools they can purchase and the budgets they have to work with. Small businesses may have a very small virtualized environment that is self-hosted on-premises, running a few websites and other business-critical resources. Monitoring is often a “nice to have” that organizations may choose to skip simply due to the lack of funds or buy-in from owners and other business stakeholders. I want to highlight a web monitoring software for small business environments called PRTG. I have used PRTG in the home lab for a few years now and also in production environments and it provides a really great solution that can be used for all kinds of monitoring use cases.
Web Monitoring requirements
What do most businesses want their web monitoring to do for them? Web monitoring may need to do some of the following types of checks on a website or web-related infrastructure:
- Monitor to check web ports are up and available – Monitor that a site is available on port 80/443
- Perform content checks – Check for specific content displayed on the web page
- Measure response time – Measure the response time of the web site
- Monitor underlying web server performance – Check the web server for performance issues (high CPU, memory, disk contention, etc)
- Monitor web server health – Are there underlying issues with the server itself (hardware alarms, etc)?
- Perform escalated notifications – Notify admins based on escalating alerts (email, page out, etc)
- Perform automated remediation of certain issues – Perform certain automated triaging by running automated tasks
Web Monitoring Software for Small Business environments using PRTG
One of the monitoring solutions that I recommend and use in the home lab environment and see used in many production environments is PRTG Network Monitor. PRTG is a sensor-based monitoring solution that uses “sensors” to monitor various aspects of your environment, including web servers, websites, virtual infrastructure, networks, etc.
With PRTG, you can do all of the above-mentioned tasks related to web monitoring, notifications, and automated remediation. Let’s highlight a few of these and how these are configured.
Monitor web ports, content, and response time
One of the basic tests that you most likely would want to configure for web monitoring is checking that standard web ports are available on your server, including 80 and 443 (hopefully 443). If these ports are not available, it can mean your web server has stopped or is down.
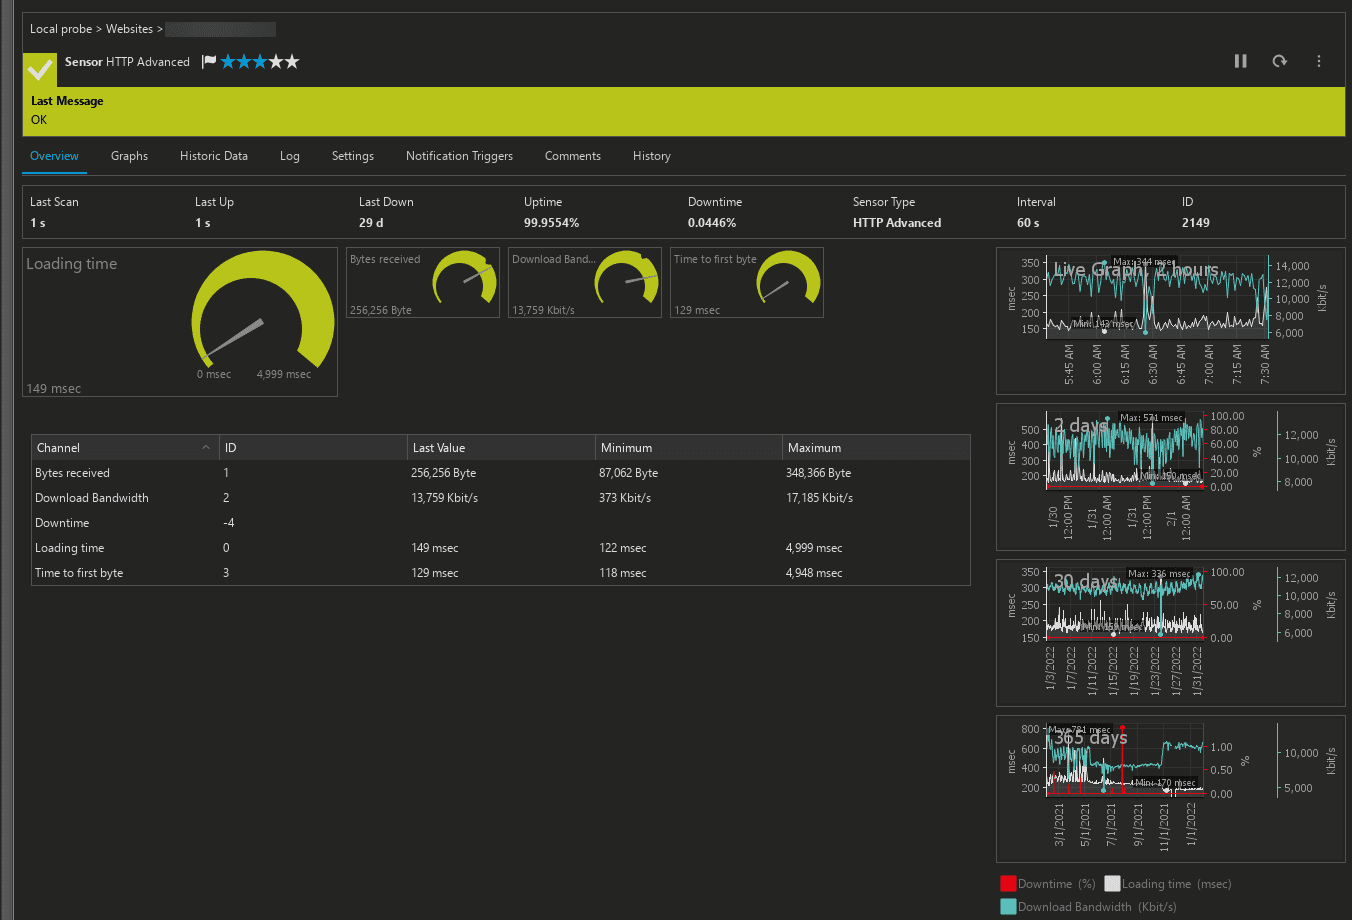
PRTG has an excellent array of web sensors that can check various things with a web site. It includes the ability to pull the URL of the website which, by extension, is checking the port in the process. The HTTP Advanced sensor checks various metrics, including:
- Loading time
- Time to first byte
- Uptime/downtime
- It can scrape for content you want to check
- It can check websites that require authentication
PRTG provides really great-looking sensors and they not only look good, but they also provide real value. As you can see below, you have the ability to see details of the web requests made and the historical values so you can trend behaviors over time.
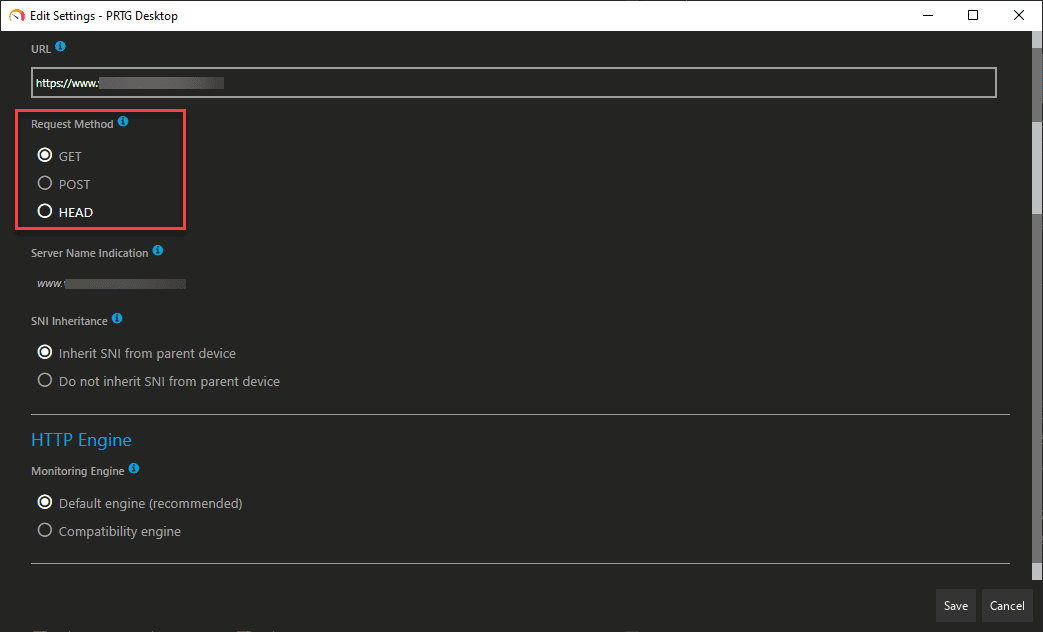
Below, the HTTP Advanced sensor allows querying data from the page in the form of a GET, POST, or HEAD lookup.
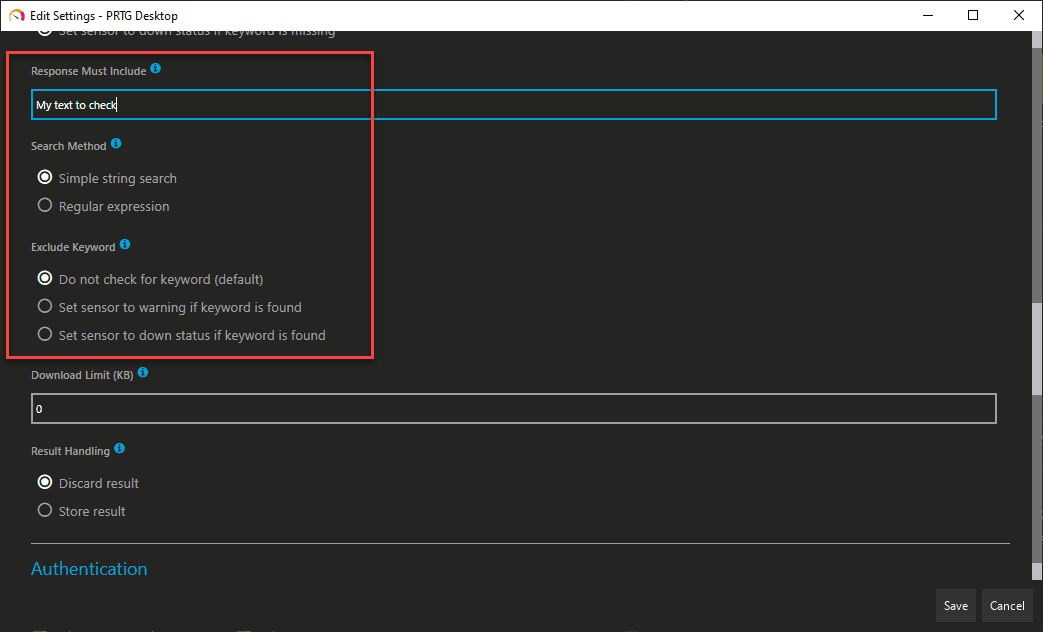
You can check for specific text with the Response must include field. You can also perform the inverse of that. If certain text is found, you can alert on that as well with the Exclude keyword.
Monitor web server performance and health and Hypervisor performance and health
Aside from web monitoring software for small business environments at the application level, you can also monitor the underlying web server performance. Below, you can see we are monitoring key performance indicators of a Windows Server to ensure Windows itself is functioning properly. After all, if your web server is ailing, you will undoubtedly see performance and other issues at the website level of your web application.
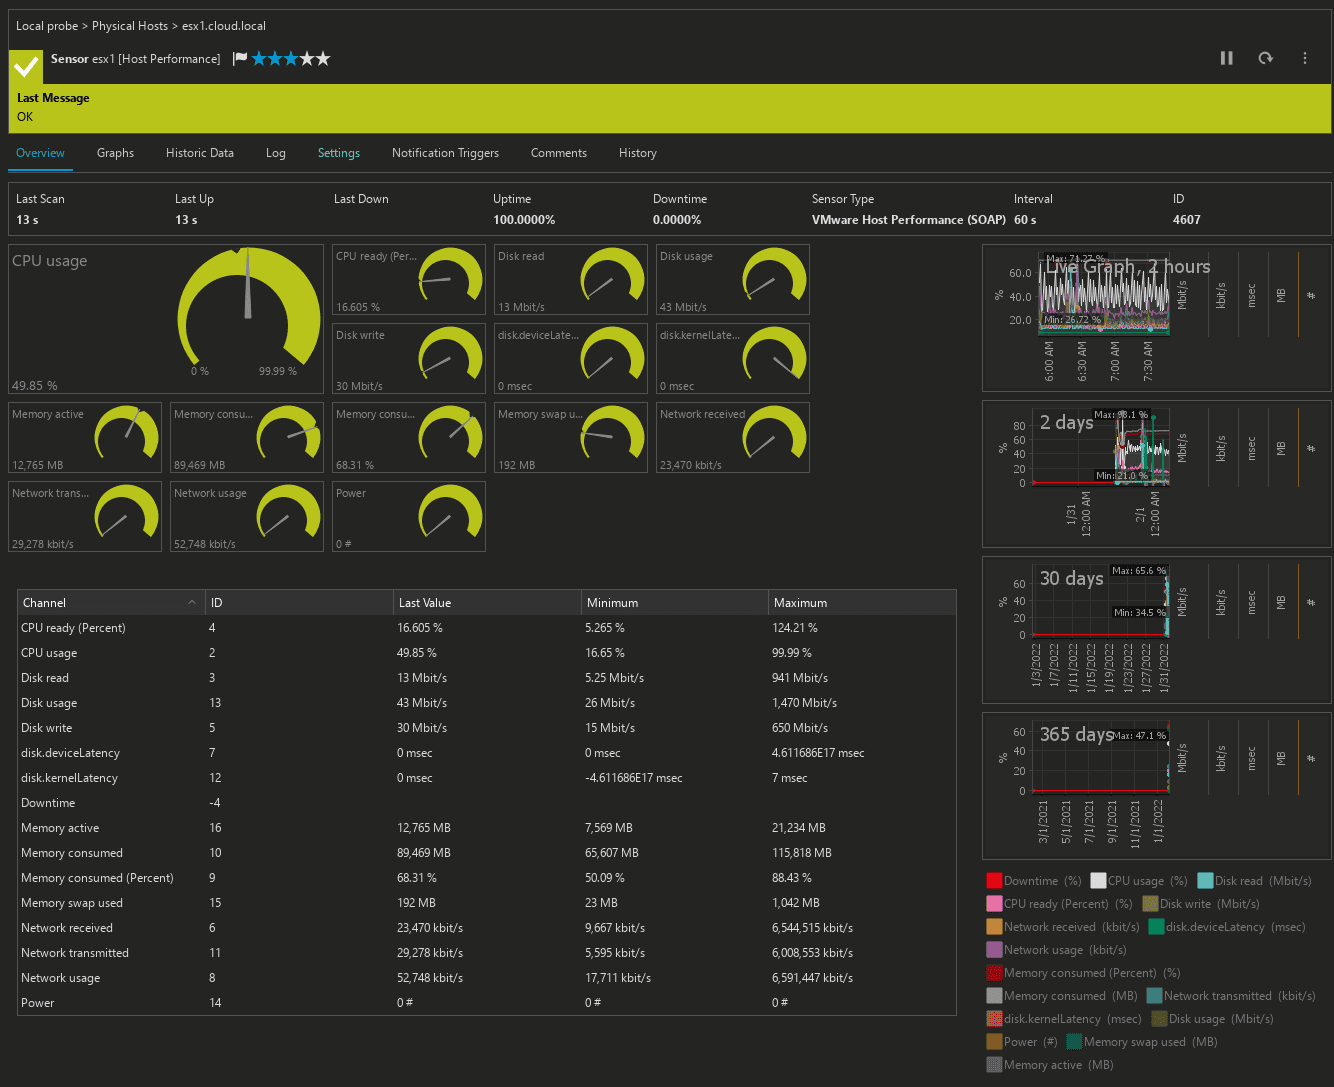
Aside from monitoring a physical or guest operating system hosting your web server, either Windows or Linux, you can monitor the hypervisor hosts that house the guest virtual machine. Below is a look at the monitoring statistics of an ESXi host in a vSphere cluster. You get detailed information, including:
- CPU ready
- CPU sage
- Disk read
- Disk usage
- Disk write
- disk.deviceLatency
- disk.kernelLatency
- Downtime
- Memory active
- Memory consumed
- Memory consumed (Percent)
- Memory swap used
- Network received
- Network transmitted
- Network usage
- Power
Perform escalated notifications
One of the features of PRTG I really like is the easy, built-in escalated notifications that are configurable. You can notify on a wide range of triggers:
- State trigger – is a sensor UP or DOWN
- Speed trigger – measure and alert on speed/performance
- Volume trigger – alert on a volume of changes or other items in the environment
- Threshold trigger – if a value is over a certain threshold (CPU over certain %)
- Change trigger – if a sensor changes, alert on the change
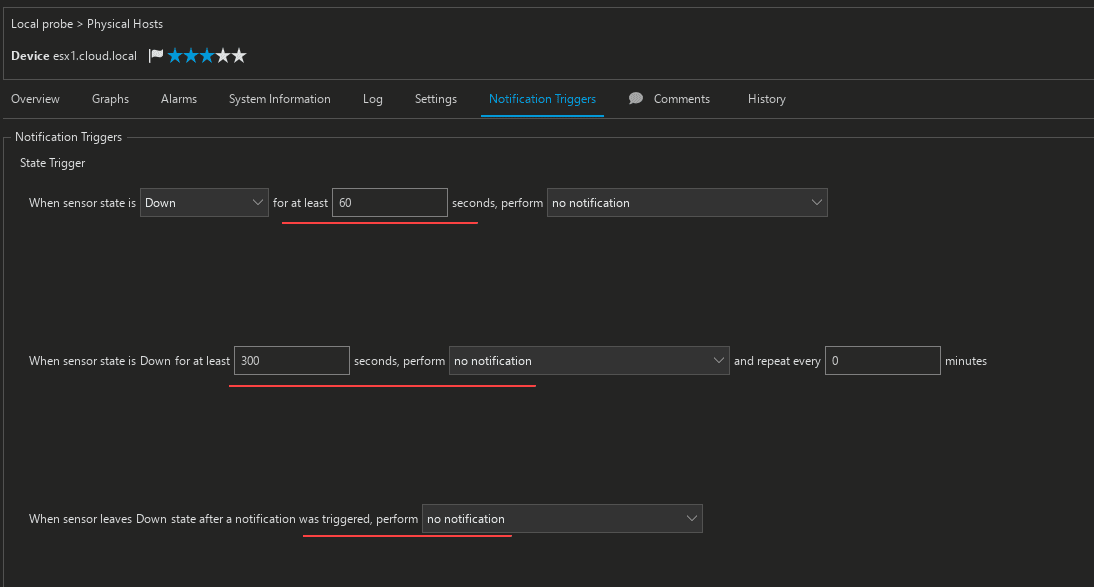
Notice in the quick look at adding notification triggers to the ESXi host listed above, if you click the Add State trigger under Notification triggers, you get built-in defaults you can easily configure, such as when a sensor is down for 60 seconds, down for 300 seconds, and then when it returns to normal. Of course, you can easily adjust these to suit your business and technical needs.
Perform automated remediation of certain issues
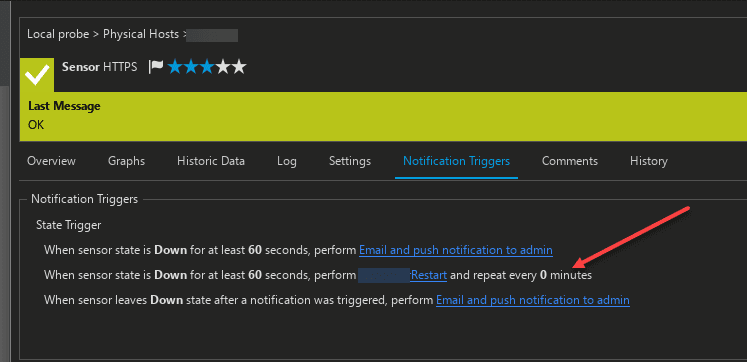
Another great feature is the ability to run automated notification remediation scripts. These are essentially PowerShell or batch scripts you can run when you see certain notification events. For example, let’s say you want to restart IIS when you see a website down for 60 seconds. You can do that with the notification script trigger.
PRTG free version – 100 sensors
For Web Monitoring Software for Small Business environments, the PRTG free version includes 100 sensors. This is plenty of sensors to monitor a website or two, the underlying web servers, and a hypervisor host, and is a great way to include monitoring of business-critical sites, even on a tight budget.
You can check out more information on the PRTG free version here: How to: Free network monitoring with PRTG (paessler.com)
Wrapping Up
Web monitoring is a key task for businesses running self-hosted or even cloud-hosted infrastructure. PRTG has a wealth of functionality built into the solution that provides quick time to value to monitor business-critical sites. I have run PRTG in the home lab for quite some time and have seen it/recommended it in a number of production environments and it has worked well.
There are other monitoring solutions I like as well. The key is to monitor. Without monitoring, there is no way to understand what is really going on in your environment and trend issues that may correlate with other things in the environment.



0 Comments